Look ahead

G.A.T. Engine general discussion
Post Reply
pusha
Knowledgeable
Knowledgeable
Posts: 155
Joined: Mon Nov 15, 2010 10:33 am

Look ahead

Post by pusha » Tue Jan 12, 2016 11:08 pm

Hello everyone,

i was looking up the new features in GAT and found something that i haven't managed to fully understand.

http://fs5.directupload.net/images/160112/jkbgx676.png

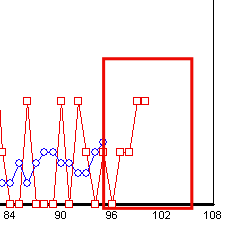
I've read the help file, where it states that the blue line indicate the average hit/draw. Shouldn't it on the right of the red line? The actual presentation makes my mind flip. I'd think that the next 5 red dots after the last blue dots would represent the possible hit in the next 5 draws. Do i've an error in reasoning? Because as i understand, red dots represent the hits from the tested draws.

Many thanks for your contribution in solving "my" mystery :lol:

Cheers,
pusha.

User avatar
lottoarchitect
Site Admin
Posts: 1635
Joined: Tue Jan 15, 2008 5:03 pm
Location: Greece
Contact:

Re: Look ahead

Post by lottoarchitect » Wed Jan 13, 2016 10:25 am

it should be on the right however the primary information displayed at the graph is the actual hits of the tested draws (red line). If I display the blue line at the right side, the red dots will have to end some place before the right side of the graph and the numbering below the graph is actually the tested draw count, so we really mess up the information shown. For that reason, the blue line does not show on the right of the red dots, it is completely for illustration purposes only, not connected to the bottom axe of the graph.

pusha
Knowledgeable
Knowledgeable
Posts: 155
Joined: Mon Nov 15, 2010 10:33 am

Re: Look ahead

Post by pusha » Wed Jan 13, 2016 11:50 am

Hi LA,

good to know. Thanks a lot for your feedback and giving me more clear view of the graph.


Cheers,
pusha.

kalmara
Casual
Casual
Posts: 16
Joined: Wed Dec 30, 2015 11:19 pm

Re: Look ahead

Post by kalmara » Wed Jan 13, 2016 12:59 pm

Please, correct me if I'm wrong.
The way I'm seeing it is that the blue line represents the "overall behaviour" of that particular GAT over the selected test draws range, but does it show the ability of that GAT to recalibrate? For example - when I'm browsing tables, I'm searching for pattern-looking cold cycle recoveries in the blue graph, and when the end of the line (rightmost) looks like both *the beginning of a hill* (quote:Anastasios) AND matches some 2-3-4 similar looking recoveries over the last 100 draws, then I decide to use that GAT. All of this is the second manual "eye-filter" (out of 3 or 4 maybe), which I use to scale the 10-15 best looking GAT's down to 2-3 and use them.
Feel free to criticize me for what to and what not to do out of my collected chunks of info so far.
Overall - It's been 10 days since I purchased the engine, and things are starting to make more and more sense after each read & try, but I may be wrong.

Cheers,
kalmara.
Your friendly neighborhood,
kalmara.

pusha
Knowledgeable
Knowledgeable
Posts: 155
Joined: Mon Nov 15, 2010 10:33 am

Re: Look ahead

Post by pusha » Wed Jan 13, 2016 6:47 pm

kalmara,

you're absolute right about that. Imho the blue line represents the average hit and of the next future draws (X look ahead). And how i now understand the red line after the explanation of LA, is that the last 5 red dots represents the hit result of the last but one blue dot?!

Cheers,
pusha.

User avatar
lottoarchitect
Site Admin
Posts: 1635
Joined: Tue Jan 15, 2008 5:03 pm
Location: Greece
Contact:

Re: Look ahead

Post by lottoarchitect » Wed Jan 13, 2016 7:38 pm

kalmara, you are on the right track usage about the blue line.
Pusha, the last blue dot shown is the average of the last 5 red dots (when averaged on 5 dots).

Post Reply

Who is online

Users browsing this forum: No registered users and 120 guests